Financial Highlights
Financial Highlights
Financial Highlights
| RUB million, unless otherwise stated | 2016 | 2017 | Change, % |
| Revenue | 495,880 | 532,934 | 7.5 |
| EBITDAR1 | 137,567 | 121,808 | (11.5) |
| EBITDAR margin, % | 27.7 | 22.9 | (4.8 p.p.) |
| EBITDA1 | 78,004 | 56,015 | (28.2) |
| EBITDA margin, % | 15.7 | 10.5 | (5.2) p.p. |
| Operating profit | 63,254 | 40,411 | (36.1) |
| Operating profit margin, % | 12.8 | 7.6 | (5.2) p.p. |
| Profit for the period | 38,826 | 23,060 | (40.6) |
| Net profit margin, % | 7.8 | 4.3 | (3.5) p.p. |
| 1 EBITDAR = EBITDA + operating lease expenses. EBITDA = operating profit + depreciation and amortisation + customs duties. | |||
2017 was yet another landmark year for Aeroflot Group, as its airlines carried 50.1 million passengers, up 15.4% year-on-year. The Group took full advantage of the opportunities offered by the growing passenger transportation market in both the scheduled and charter segments. The Group continued its sustainable growth on domestic and international routes. Aeroflot Group ensured a high utilisation rate of its much increased capacity (+14,2% year-on-year), with the passenger load factor up 1.4 p.p. year-on-year to 82.8%. Therefore, operations development and growth were the key drivers of financial results.
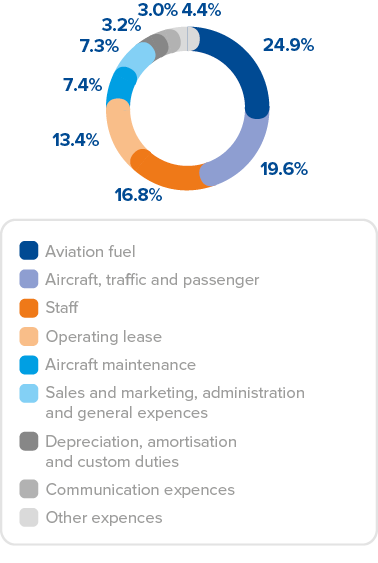
Furthermore, the 2017 financial results reflect the normalisation of the margins to the Group’s historical profitability driven by a number of market factors. A changing competitive landscape and international carriers adding capacity back into the Russian market and the re-opening of the Turkish market with subsequent structural changes in demand, as well as the rouble appreciation, put pressure on yields. On the other hand, higher oil prices and changes in the correlation pattern between oil and exchange rate contributed to an increase in fuel costs, a key expense item accounting for 24.9% of operating costs.
Given the impact of FX swings and higher fuel prices – as well as lower income on returns of prepayments for aircraft related to exchange rate differences accounted for in P&L that affected the 2016 results (FX effect on returns of prepayments in 2016 totalled about RUB 12.7 billion) – the financial result for 2017 was lower. In turn, the significant reduction of the debt burden thanks to early repayment of credit lines during the year, as well as savings on other non-operational costs, supported net profit, which came in at RUB 23,060 million.
Traffic and other revenue
Revenue
| RUB million, unless otherwise stated | 2016 | 2017 | Change, % |
| Revenue from passenger flights | 421,377 | 458,390 | 8.8 |
| including scheduled flights | 403,760 | 427,529 | 5.9 |
| charter flights | 17,617 | 30,861 | 75.2 |
| Revenue from cargo | 12,589 | 16,526 | 31.3 |
| Total traffic revenue | 433,966 | 474,916 | 9.4 |
| Other revenue | 61,914 | 58,018 | (6.3) |
| including revenue from airline agreements | 35,923 | 33,196 | (7.6) |
| revenue from FFP partners | 11,846 | 11,588 | (2.2) |
| other revenue | 14,145 | 13,234 | (6.4) |
| Total revenue | 495,880 | 532,934 | 7.5 |
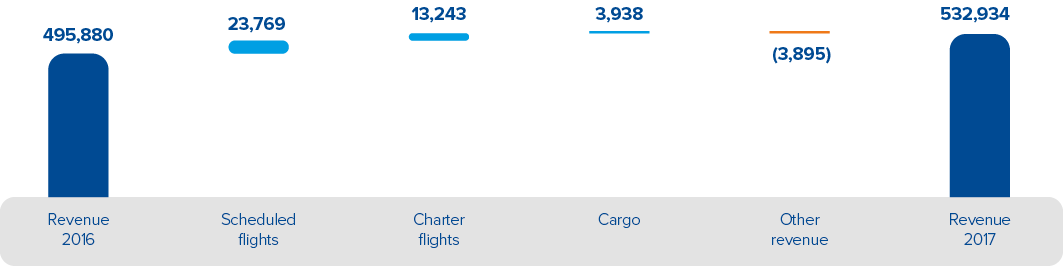
In 2017, Aeroflot Group’s revenue increased by 7.5% year-on-year to RUB 532,934 million.
Revenue from scheduled passenger flights increased by 5.9% year-on-year to RUB 427,529 million, driven by an increase in passenger traffic. Revenue growth was affected by a decrease in yields, primarily on international routes, due to the rouble appreciation and a corresponding adjustment to FX-denominated revenue.
Revenue from charter flights increased by 75.2% to RUB 30,861 million, supported, among other things, by the expansion of Rossiya’s charter programme. Rapid growth resulted in revenue from charter flights increasing from 3.6% of the Group’s total revenue in 2016 to 5.8% in 2017.
Revenue from cargo increased by 31.3% year-on-year to RUB 16,526 million on the back of additions of wide-body aircraft to the Group’s fleet and a 32.8% growth in the cargo and mail volumes. This increase enabled the share of cargo revenue to grow from 2.5% in 2016 to 3.1% in 2017.
Other revenue decreased by 6.3% year-on-year to RUB 58,018 million, mainly due to a decrease in the rouble equivalent of FX-denominated revenues from airline agreements as a consequence of exchange rate fluctuations.
Revenue growth decomposition
RUB MILLION
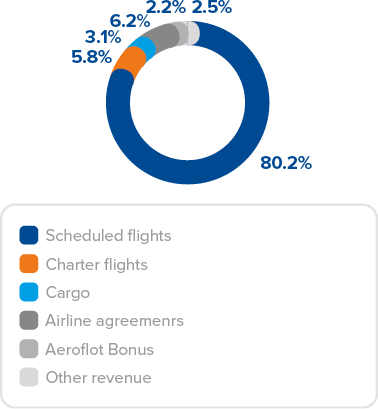
Revenue breakdown, 2017
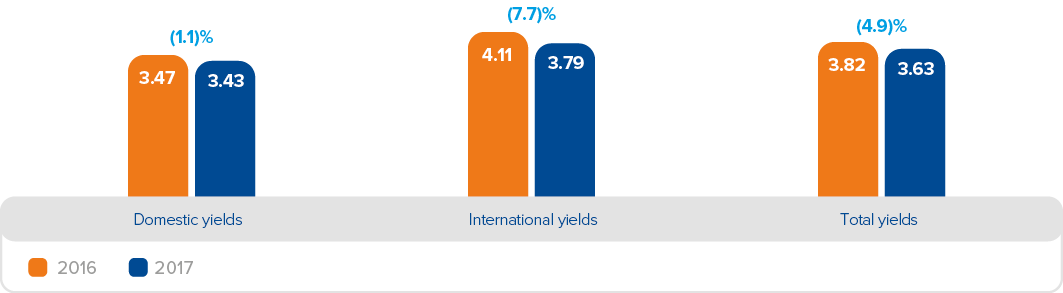
Yields
In 2017, scheduled flight yields decreased by 4.9% including yields on international destinations (by 7.7%) and yields on domestic destinations (by 1.1%). Yields were mainly influenced by the competitive environment in the market and the development of Pobeda airline which, being a low-cost carrier, provides air transportation with lower yields. International yield decrease primarily resulted from the foreign exchange effect as all fare groups (for outbound and inbound flights and for international transfer) are denominated in foreign currencies. In particular, during the year, the rouble appreciated by 11.2% against the euro and by 13.0% against the US dollar (the average of RUB 74.2 per EUR and RUB 67.0 per USD in 2016; RUB 65.9 per EUR and RUB 58.4 per USD in 2017).
Domestic yields came under pressure from competition and the route network mix (long-haul operations development at Rossiya airline). As a result, Rossiya’s average distance flown increased from 2,300 kilometres to 2,500 kilometres, or by 8.3%, while the share of flights to the cities of the Far East in the airline’s total passenger-kilometres on domestic flights increased from 21.6% in 2016 to 27.6% in 2017.
In the international segment, FX rates complemented the effect of competition. Rouble appreciation boosted demand, while increased demand resulted in capacity growth both from foreign carriers and Russian charter operators. At the same time, the re-opening of the Turkish market in late 2016 had a major impact on the results in the reporting period and determined the geographical re-distribution of demand from Russian consumers.
Scheduled flight yields
RUB MILLION
Scheduled flight RASK
RUB
Total RASK (including other revenue)
RUB
Operating costs
Operating costs
| RUB million, unless otherwise stated | 2016 | 2017 | Change, % |
| Aircraft, traffic, and passenger servicing | 87,227 | 96,418 | 10.5 |
| % of revenue | 17.6 | 18.1 | 0.5 p.p. |
| Staff | 64,682 | 82,801 | 28.0 |
| % of revenue | 13.0 | 15.5 | 2.5 p.p. |
| Operating lease | 59,563 | 65,793 | 10.5 |
| % of revenue | 12.0 | 12.3 | 0.3 p.p. |
| Aircraft maintenance | 38,236 | 36,433 | (4.7) |
| % of revenue | 7.7 | 6.8 | (0.9) p.p. |
| Sales and marketing, administration and general expenses | 30,294 | 36,139 | 19.3 |
| % of revenue | 6.1 | 6.8 | 0.7 p.p. |
| Depreciation, amortisation, and customs duties | 14,750 | 15,604 | 5.8 |
| % of revenue | 3.0 | 2.9 | (0.1) p.p. |
| Communication expenses | 14,697 | 14,795 | 0.7 |
| % of revenue | 3.0 | 2.8 | (0.2) p.p. |
| Other expenses | 21,595 | 21,855 | 1.2 |
| % of revenue | 4.4 | 4.1 | (0.3) p.p. |
| Operating costs, excluding aircraft fuel | 331,044 | 369,838 | 11.7 |
| % of revenue | 66.8 | 69.4 | 2.6 p.p. |
| Aviation fuel | 101,582 | 122,685 | 20.8 |
| % of revenue | 20.5 | 23.0 | 2.5 p.p. |
| Total operating costs | 432,626 | 492,523 | 13.8 |
| % of revenue | 87.2 | 92.4 | 5.2 p.p. |
In 2017, aviation fuel costs increased by 20.8% year-on-year to RUB 122,685 million. The increase was driven by higher rouble-denomination average price of aviation fuel amid changes in the price of oil and exchange rates, as well as an increase in traffic and flight hours.
The strengthening of the rouble mitigated the increase in expenses due to the Group’s expansion. Excluding aviation fuel costs, operating costs increased by 11.7% year-on-year to RUB 369,838 million.
Aircraft and passenger servicing costs totalled RUB 96,418 million, up 10.5% year-on-year, due primarily to the growth of passenger traffic and increased airport taxes. This item was also impacted by new initiatives aimed at boosting service quality.
Staff costs grew 28.0% year-on-year and totalled RUB 82,801 million, as a result of wage indexation in accordance with the collective bargaining agreement, an increase in the number of staff to support operational growth, growth of the variable component of remuneration linked to the achievement of corporate KPIs (for FY2016), and an increase in unused vacation fund (one-off adjustment), as well as payment of bonuses to pilots.
Operating lease expenses grew to RUB 65,793 million, up 10.5% year-on-year, due to fleet expansion (the net increase in the Group’s leased fleet was 42 aircraft, or 17.7%, compared with 31 December 2016) and an increase in the average LIBOR 6M rate by 0.42 p.p. year-on-year.
Aircraft maintenance costs decreased by 4.7% year-on-year to RUB 36,433 million. Aircraft maintenance costs were significantly impacted by the rouble appreciation, as well as by the ongoing development of A-Technics, Group’s maintenance subsidiary, resulting in increasing volumes of in-house maintenance.
Sales and marketing, administration and general expenses grew by 19.3% year-on-year to RUB 36,139 million due to increased investments in marketing campaigns, in particular, promoting Aeroflot in key international markets. This programme is delivering notable results as Aeroflot carried 4.4 million international transfer passengers in 2017, a 18.6% increase year-on-year.
Depreciation, amortisation and customs duties increased by 5.8% year-on-year to RUB 15,604 million due to the commissioning of IT equipment during the year.
Communication expenses including the services of global distribution systems totalled RUB 14,795 million having increased insignificantly by 0.7% due to the operations growth and the rouble appreciation.
Other expenses increased by 1.2% year-on-year to RUB 21,855 million.
Decomposition of changes in operating costs
RUB MILLION
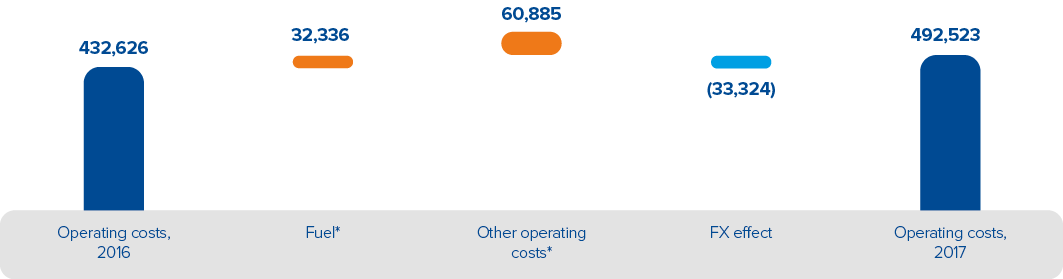
Operating costs breakdown, 2017
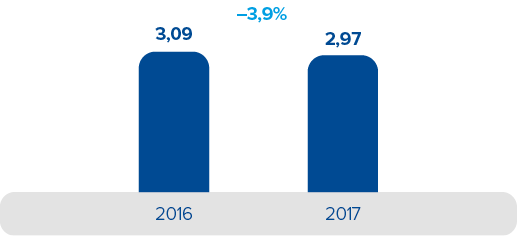
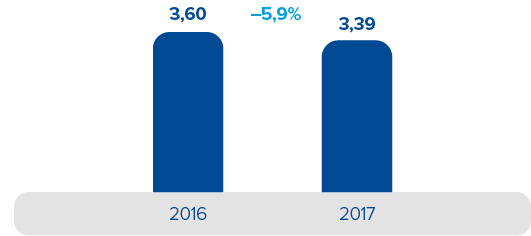
Cost per available seat-kilometre (CASK)
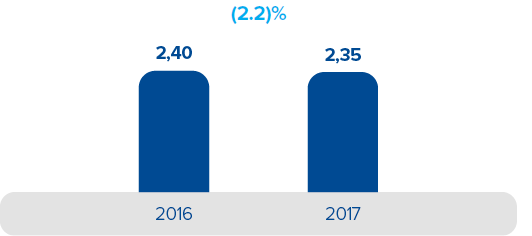
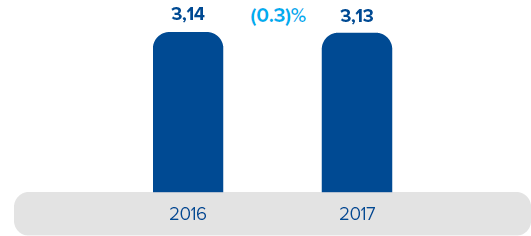
During the year, the Company exercised efficient cost control. Cost per available seat-kilometre (CASK) decreased by 0.3% to RUB 3.13, under driven largely by a 5.8% growth of specific aviation fuel costs. Excluding fuel costs, CASK decreased by 2.2% or by RUB 2.35 per seat-kilometre.
CASK excluding specific fuel costs
RUB
Total CASK
RUB
EBITDA and EBITDAR
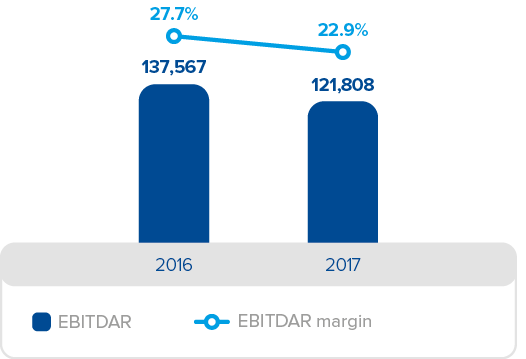
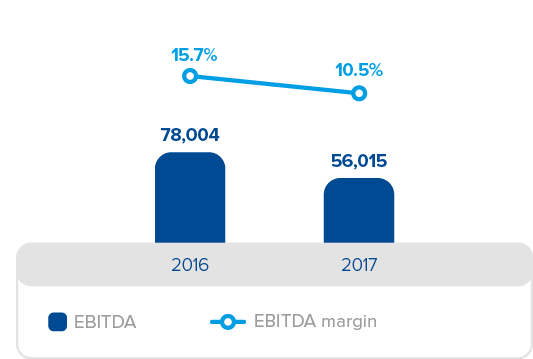
In 2017, Aeroflot Group’s EBITDA totalled RUB 56,015 million. EBITDA margin decreased to 10.5% (15.7% in 2016). EBITDAR for 2017 was RUB 121,808 million. EBITDAR margin decreased to 22.9% (27.7% in 2016). This trend reflects the normalisation of profitability and the impact of the aforementioned factors.
EBITDAR and EBITDAR margin
RUB MILLION AND %
EBITDA and EBITDA margin
RUB MILLION AND %
Finance income and costs
Non-operating profit and loss
| RUB million, unless otherwise stated | 2016 | 2017 | Change, % |
| Operating profit | 63,254 | 40,411 | (36.1) |
| Loss from sale and impairment of investments, net | (2,935) | (144) | (95.1) |
| Finance income | 19,802 | 7,127 | (64.0) |
| Finance costs | (9,443) | (8,225) | (12.9) |
| Hedging result | (12,310) | (5,613) | (54.4) |
| Share of results of associates | 12 | 170 | - |
| Result from disposal of subsidiaries | (5,099) | - | - |
| Profit before income tax | 53,281 | 33,726 | (36.7) |
| Income tax expense | (14,455) | (10,666) | (26.2) |
| Profit for the period | 38,826 | 23,060 | (40.6) |
Finance income decreased by 64.0% year-on-year to RUB 7,127 million, mainly due to lower foreign exchange gains.
Finance costs decreased by 12.9% year-on-year to RUB 8,225 million, primarily due to falling debt levels and a subsequent reduction in loan interest expense.
The hedging result of RUB 5,613 million was attributable to the effect of revenue hedging with liabilities in foreing currencies (finance lease). This cost item does not cover hedging transactions as no such contracts existed in the reporting period; instead, it reflects the FX effect of finance lease revaluation related to actual payments during the reporting period. The rouble appreciation had a positive impact on finance lease liabilities and respective effect of revaluation recognised in Company’s equity.
Cash flows
Condensed consolidated statement of cash flows
| RUB million, unless otherwise stated | 2016 | 2017 | Change, % |
| Profit before income tax | 53,281 | 33,726 | (36.7) |
| Cash flows from operating activities before working capital changes | 81,994 | 65,330 | (20.3) |
| Increase in accounts receivable and prepayments | (6,191) | (27,816) | >100 |
| Increase in expendable spare parts and inventories | (2,809) | (2,672) | (4.9) |
| Increase in accounts payable and accrued liabilities | 13,387 | 24,964 | 86.5 |
| Cash flows from operating activities after working capital changes | 86,381 | 59,806 | (30.8) |
| Income tax paid | (13,943) | (13,019) | (6.6) |
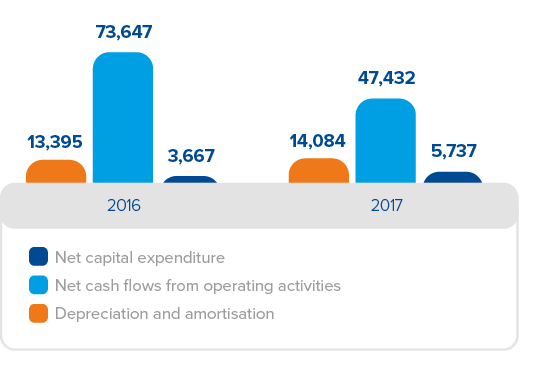
| Net cash flows from operating activities | 73,647 | 47,432 | (35.6) |
| Cash flows from investing activities: | |||
| Purchases of PPE and intangible assets | (10,222) | (7,681) | (24.9) |
| Prepayments for aircraft | (18,806) | (7,931) | (57.8) |
| Return of prepayments for aircraft | 29,362 | 26,274 | (10.5) |
| Net cash flows used from investing activities | 10,331 | 14,369 | 39.1 |
| Free cash flow | 83,978 | 61,801 | (26.4) |
| Cash flows from financing activities: | |||
| Repayment of loans and borrowings | (72,991) | (17,417) | (76.1) |
| Repayment of the principal of financial lease liabilities | (27,024) | (15,513) | (42.6) |
| Net cash flows used in financing activities | 80,495 | 46,821 | (41.8) |
| Net increase in cash and cash equivalents | 783 | 14,502 | >100 |
| Cash and cash equivalents at the end of the period | 31,476 | 45,978 | 46.1 |
Cash flows from operating activities
In 2017, net cash flows from operating activities reached RUB 47,432 million in 2017, while profit before income tax amounted to RUB 33.736 million. Key non-cash adjustments of profit before income tax made to net cash flows from operating activities for 2017 were related to:
- changes in provisions, mainly attributable to accrual of the provision for scheduled maintenance and repair of aircraft, and the provision for doubtful accounts
- hedging result attributable to the effect of revenue hedging with liabilities in foreign currency (reflection of the FX effect of revaluation of finance lease in the reporting period)
- foreign exchange gain
- depreciation and amortisation.
Working capital
In the reporting period, working capital change was RUB 5,524 million, mainly impacted by an increase of RUB 27,816 million in accounts receivable and prepayments, in line with revenue growth.
Cash flows from operating activities were largely affected by an increase in accounts payable and accrued liabilities, in line with the growth in operating costs by 13.8% in 2017.
Free cash flow
In 2017, free cash flow totalled RUB 61,801 million. A 26.4% decrease compared to 2016 resulted from a 35.6% decrease in net cash flows from operating activities, as well as from a 39.1% increase in net cash flows from investing activities.
Cash and cash equivalents grew by 46.1% to RUB 45,978 million, driven among other factors by the effect of exchange rate fluctuations.
Net capital expenditure, cash flows from operating activities, depreciation and amortisation
RUB MILLION
Cash flows from operating activities and free cash flow
RUB MILLION

Note. Net capital expenditure is capital expenditure less proceeds from sale of property, plant and equipment, and proceeds from sale of assets held for sale.
Capital expenditure
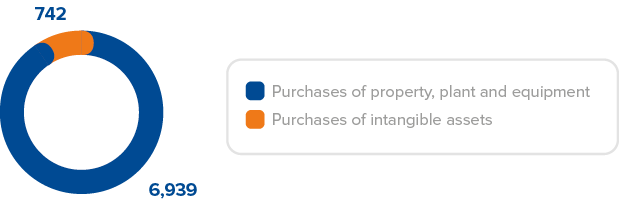
In 2017, capital expenditure totalled RUB 5,737 million. Purchases of property, plant and equipment are primarily included equipment acquired by PJSC Aeroflot under finance lease for RUB 1,872 million, and spare parts for PJSC Aeroflot’s aircraft used for overhaul acquired for RUB 1,583 million.
Purchases of intangible assets in 2017 mainly included SAP development software, as well as other software solutions and licences for office and other IT systems.
Net capital expenditure
| RUB million, unless otherwise stated | 31.12.2016 | 31.12.2017 | Change, % |
| Purchases of PPE and intangible assets | (10,222) | (7,681) | (24.9) |
| Proceeds from sale of assets held for sale | 6,471 | 1,856 | (71.3) |
| Proceeds from sale of property, plant and equipment | 84 | 88 | 4.8 |
| Net capital expenditure | (3,667) | (5,737) | 56.4 |
Non-current assets
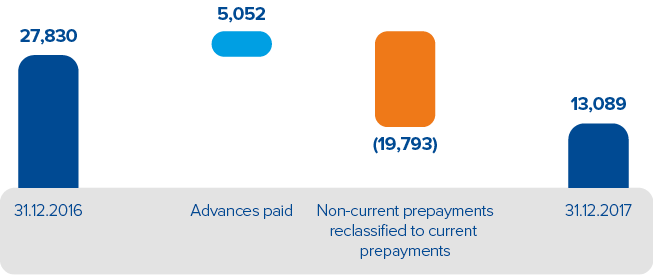
In 2017, non-current decreased by 8.3% and reached RUB 155,128 million, primarily driven by a 53.0% decrease in prepayments for aircraft due to the reclassification of non-current prepayments to current prepayments.
Purchases of property, plant and equipment, and intangible assets
RUB MILLION
Change in prepayments for aircraft (non-current portion)
RUB MILLION
Current assets
Current assets increased by 29.2% and reached RUB 168,202 million. The change was mainly due to a 46.1% increase in cash and cash equivalents, and an 18.9% increase in accounts receivable and prepayments.
Equity
In 2017, equity, including non-controlling interest, grew to RUB 67,299 million.
The key driver behind this change was the decrease in the hedging reserve, which comprised revaluation of derivatives under IAS 39 and revaluation of finance lease liabilities. Another contributor to the gain was an increase in profit from sale of treasury shares, mainly driven by the sale of its quasi-treasury stock by the subsidiary Aeroflot-Finance.
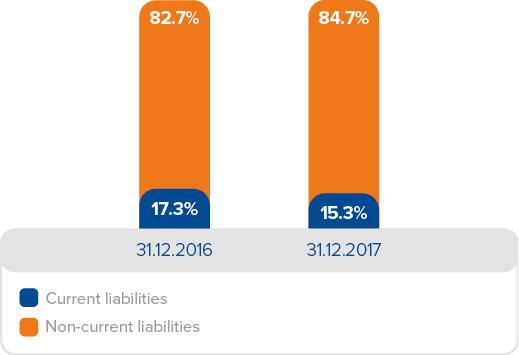
Current liabilities
In 2017, total current liabilities increased by 16.8% due to an increase in accounts payable and accrued liabilities, unearned traffic revenue, and provisions for liabilities by 36.3%, 11.9%, and 77.8% respectively.
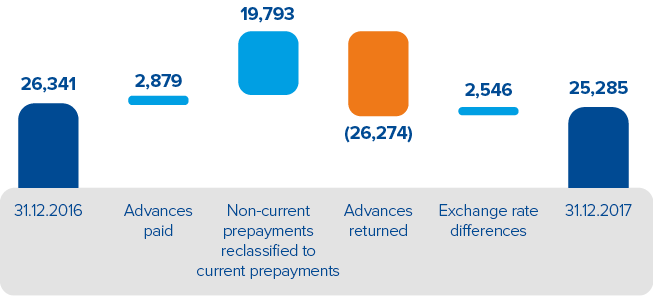
Change in prepayments for aircraft (current portion) RUB
RUB MILLION
Non-current liabilities
In 2017, non-current liabilities decreased by 16.5% to RUB 115,005 million. The key drivers behind this decrease were finance lease liabilities, which went down by 18.0% due to the rouble appreciation in the reporting period and the reclassification of non-current liabilities to current liabilities.
Debt and liquidity
As at 31 December 2017, total debt decreased by 27.2% year-on-year to RUB 104,792 million, primarily driven by scheduled and early repayments of loans and borrowings, as well as payment of finance lease liabilities, and revaluation of finance lease liabilities following the rouble appreciation against the US dollar as at 31 December 2017 compared to 31 December 2016. As a result, the Group now has two active loans totalling RUB 3,181 million. Despite significant repayments, cash and short-term financial investments increased by more than 45.3% versus 31 December 2016 and totalled RUB 54,909 million.
As at 31 December 2017, Aeroflot Group had RUB 103.2 billion undrawn credit lines from major Russian and international banks.
Debt
| RUB million, unless otherwise stated | 31.12.2016 | 31.12.2017 | Change, % |
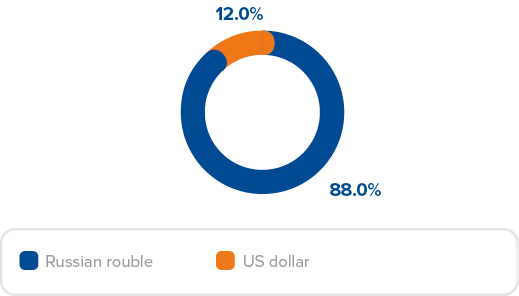
| Loans and borrowings | 20,367 | 3,181 | (84.4) |
| Finance lease | 122,736 | 100,689 | (18.0) |
| Pension liabilities | 805 | 922 | 14.5 |
| Total debt | 143,908 | 104,792 | (27.2) |
| Cash, cash equivalents, and short-term investments | 37,795 | 54,909 | 45.3 |
| Net debt | 106,113 | 49,883 | (53.0) |
| Net Debt / EBITDA ratio | 1.4х | 0.9x | - |
Breakdown of loans and borrowings by currency as at 31 December 2017
Net Debt / EBITDA ratio
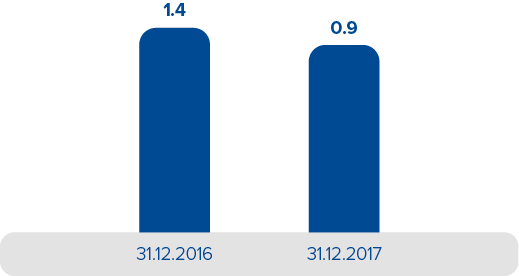
Note. Excluding operating lease capitalisation.
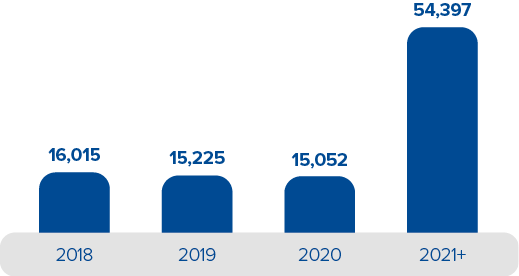
Finance lease repayment schedule
RUB MILLION
Breakdown of total debt