Market Overview
Global airline industry
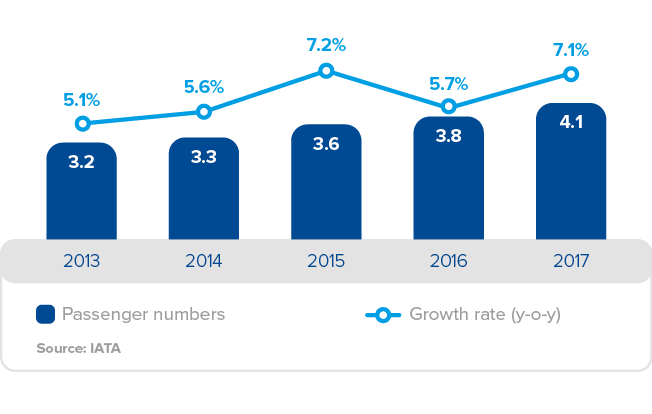
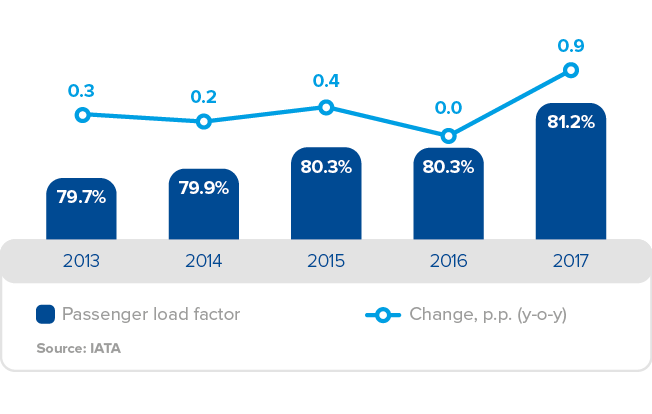
Scheduled passenger traffic grew by 7.1% to 4.1 billion passengers in 2017, with a 7.5% increase in the passenger turnover. Worldwide, the passenger load factor increased to 81.2% (vs 80.3% in 2016).
Asia-Pacific was the fastest growing market in 2017, with the passenger turnover up 10.0% year-on-year. Europe ranked second in terms of growth, with the passenger turnover growing by 8.0%. Latin America and Africa grew by 7.5% and 7.0%, respectively, while the North American market saw a 4.0% increase in the passenger turnover.
Scheduled passenger traffic
in the global market
BILLION PAX
Passenger load factor
in the global market
%
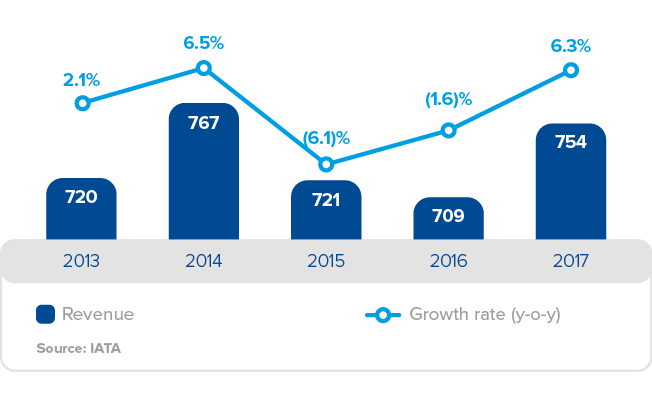
The IATA reported a 6.3% year-on-year growth in the industry-wide revenue to USD 754 billion. Passenger flights consistently account for the bulk of the industry’s revenue, their share standing at 70.6%.
Global revenue
USD BILLION
Oil and aviation fuel prices
USD PER BARREL
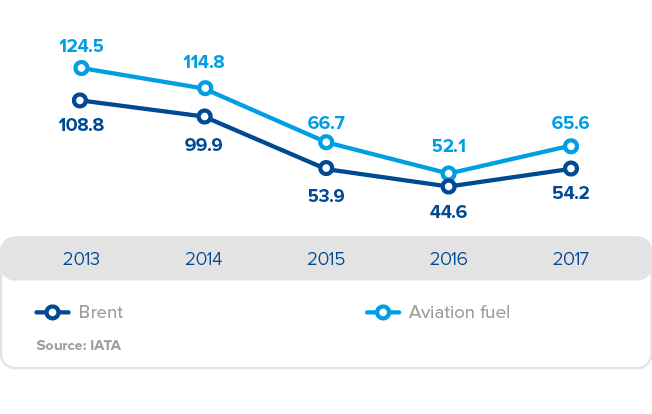
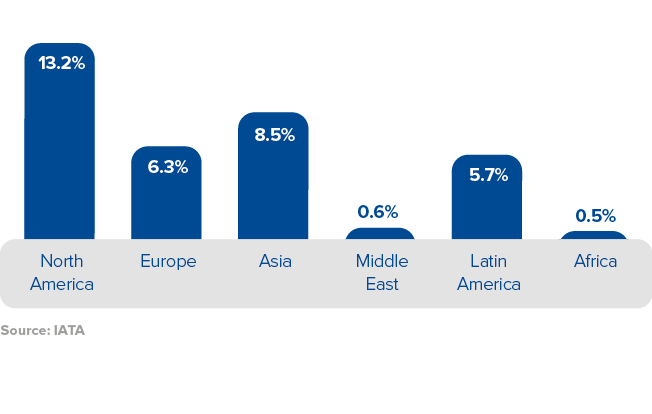
The growing passenger turnover pushed the costs up by 7.3% to USD 691 billion. During 2017, oil and, accordingly, jet fuel prices grew: overall, global jet fuel prices recovered to the 2015 level and became one of the key factors driving the EBIT margin down by 0.9 p.p. year-on-year to 8.3%. Profitability levels of different markets still vary with 13.2% in North America, 8.5% in Asia-Pacific, 6.3% in Europe, 5.7% in Latin America, and 0.6% and 0.5% in the Middle East and Africa, respectively.
Global EBIT margin in 2017 by region
%
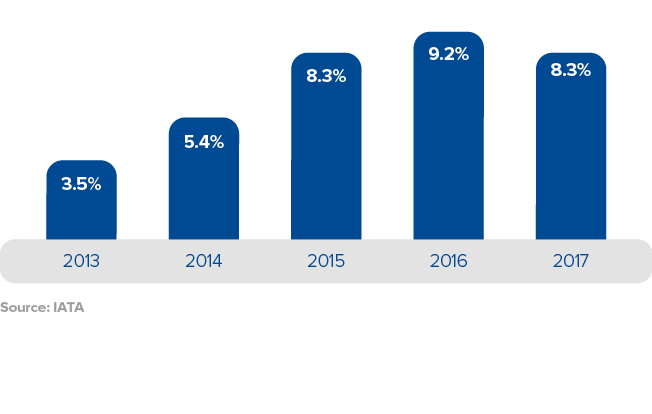
Global EBIT margin
%
Global net profit in 2017 by region
%
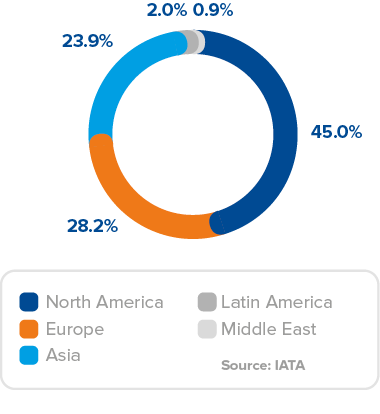
Note. Calculated based on data for regions with positive net profit. Excluding Africa which generated a net loss of USD 0.1 billion in 2017.
The IATA pre-estimated the 2017 industry’s net profit at USD 34.5 billion – one of the highest in the past decade. Despite its highly volatile financial track record, the industry has demonstrated a consistently high net income over the last eight years. However, this metric also varies with almost half of the global net profit generated by North America while flights in Africa remain in the red.
Russian airline industry
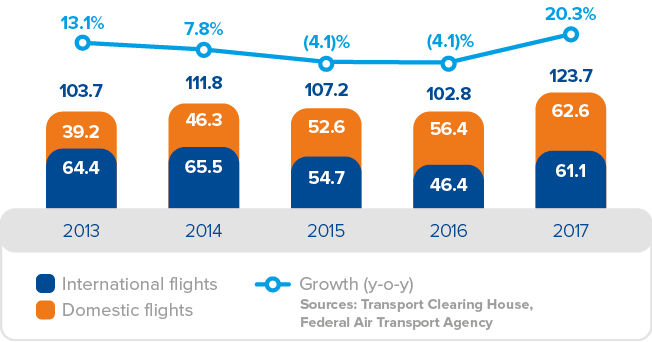
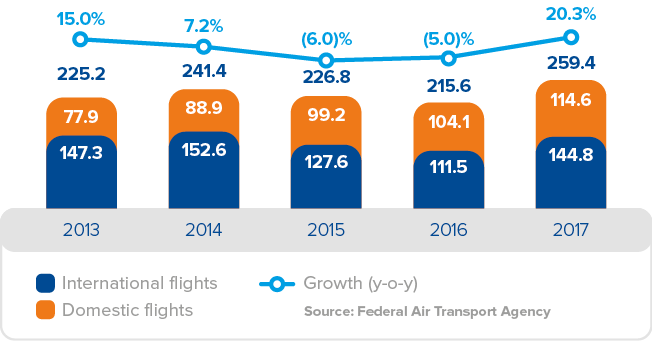
In 2017, the Russian market demonstrated a strong growth with its total size (including foreign carriers and international transit traffic serviced by Russian airlines) increasing by 20.3% to 123.7 million passengers. Russian carriers’ passenger turnover was 259.4 billion revenue passenger-kilometres (RPK), up 20.3% year-on-year.
Passenger traffic in Russia (including foreign carriers)
MILLION PAX
Passenger traffic in Russia (excluding foreign carriers)
MILLION PAX
The key growth driver in 2017 was the resumed economic growth in Russia with a stronger rouble and rising oil prices. The 2015–2016 low base effect due to Transaero’s market exit also supported the growth. International traffic was boosted by the resumption of charter flights to Turkey and released pent-up demand backed by the improved macroeconomic environment. During the peak summer season the traffic also grew due to cold weather in the European part of Russia, adding to the traffic both abroad and to resort destinations in Southern Russia.
Passenger turnover in Russia (excluding foreign carriers)
BILLION RPK
Available seat-kilometres in Russia (excluding foreign carriers)
BILLION ASK
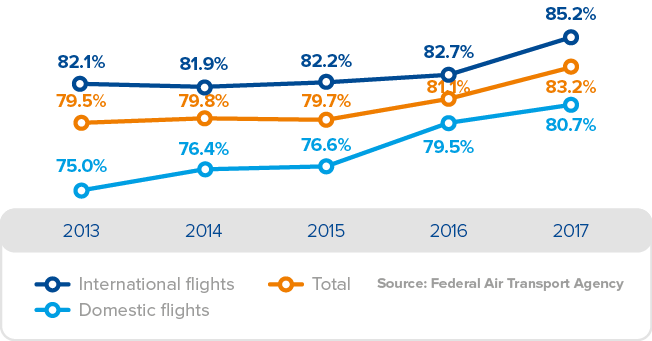
The resumption of tourist traffic to Turkey and active promotion campaigns run in the Russian market by Turkish aviation authorities and carriers ensured a 31.7% year-on-year growth in passenger traffic on international routes (including foreign carriers). The average passenger load factor for international flights was 85.2%, up 2.5 p.p. year-on-year.
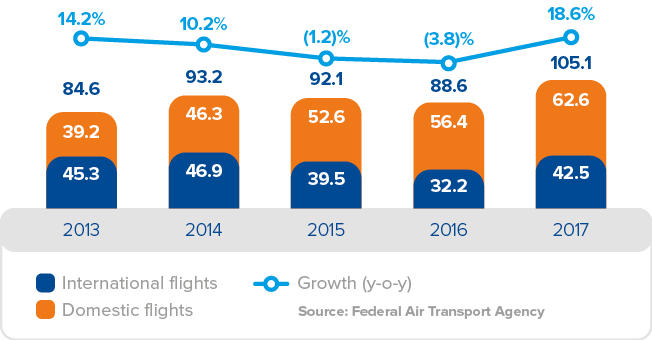
Strong growth in international traffic did not cause any churn in the domestic market which maintained a strong operating performance: the total number of passengers increased by 10.9% year-on-year to 62.6 million passengers. The passenger turnover on domestic routes totalled 114.6 billion RPK, up 10.0% year-on-year due to the expansion of domestic tourism driven by a partial shift in outbound tourism flows. The average passenger load factor for domestic flights in 2017 was 80.7%, up 1.2 p.p. year-on-year.
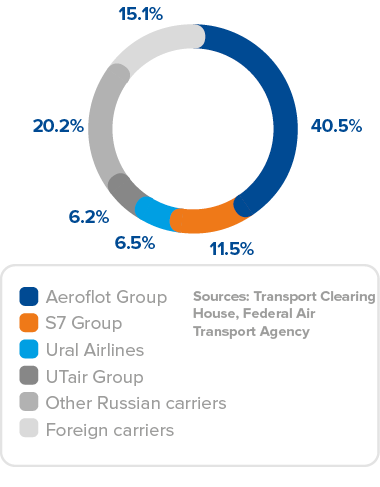
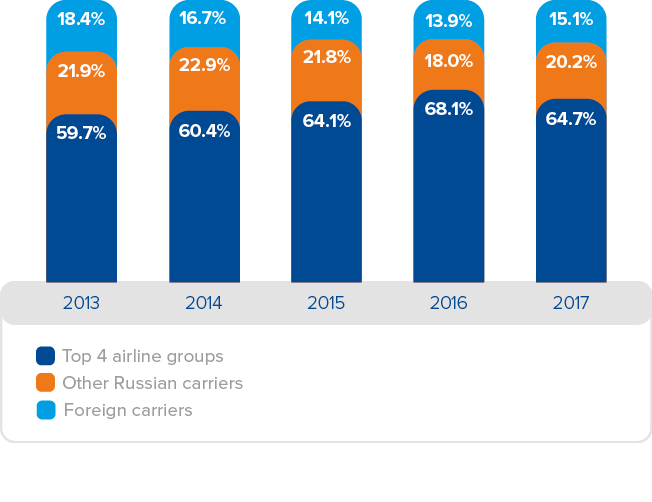
The Russian air transportation industry is highly consolidated with four largest players accounting for 64.7% of the total passenger traffic. In 2017, Aeroflot Group had 40.5% of the total Russian market by passenger traffic (including foreign carriers) vs 42.3% in 2016 due to higher charter activity driven by the resumed flights to Turkey and increased foreign carriers’ capacities. Aeroflot Group implements a targeted growth strategy focusing on the strongest market segments and despite its presence in charter segment overall exposure to it is lower compared to the market. Aeroflot Group’s “net” market1 share was 38.2% in 2017.
Aeroflot Group’s closest competitors are S7 Group (11.5%), Ural Airlines (6.5%), and UTair Group (6.2%). The share of other Russian and foreign carriers grew the most vs 2016 – by 2.2 p.p. to 20.2% and by 1.2 p.p. to 15.1%, respectively.
Passenger load factor in Russia (excluding foreign carriers)
Passenger traffic growth* in 2017: Russian vs foreign carriers
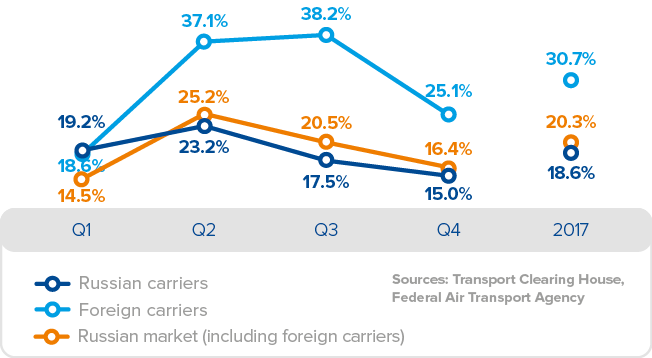
* Year-on-year change.
Key Russian airline industry players by total passenger traffic in 2017
Evolution of key players’ market shares and consolidation of the passenger transportation segment
Aeroflot Group’s market share evolution (by passenger traffic, including foreign carriers)
%
| 2013 | 2014 | 2015 | 2016 | 2017 | |
| International traffic | 27.0 | 26.1 | 29.3 | 39.4 | 36.9 |
| Domestic traffic | 36.1 | 38.0 | 44.6 | 44.6 | 44.1 |
| Total | 30.5 | 31.0 | 36.8 | 42.3 | 40.5 |
Aeroflot Group’s market share evolution by passenger traffic (“net” market*)
%
| 2013 | 2014 | 2015 | 2016 | 2017 | |
| International traffic | 24.1 | 22.6 | 24.1 | 33.9 | 31.7 |
| Domestic traffic | 36.1 | 38.0 | 44.6 | 44.6 | 44.1 |
| Total | 28.8 | 29.1 | 34.5 | 40.0 | 38.2 |
* “Net” market means the passenger traffic including foreign carriers but excluding connecting passengers on international flights, which are not relevant for the Russian O&Ds.
Aircargo market
According to the IATA, the global air cargo market totalled 59.9 million tonnes in 2017, up 9.1% year-on-year. The global cargo turnover increased by 9.3% with the industry’s cargo revenue up by 14.7% to USD 54.5 billion.
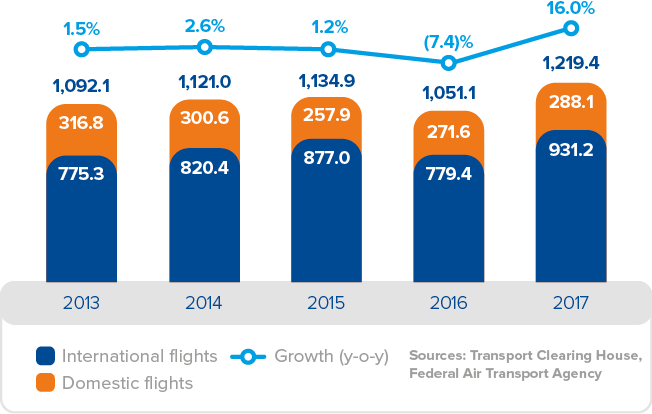
The Russian air cargo market (including foreign carriers) grew by 16.0% year-on-year in 2017 to 1.2 million tonnes. The international cargo traffic accounted for the bulk of the market at 76.4%, having increased by 19.5% to 931.2 thousand tonnes. The domestic cargo traffic was up by 6.1% to 288.1 thousand tonnes.
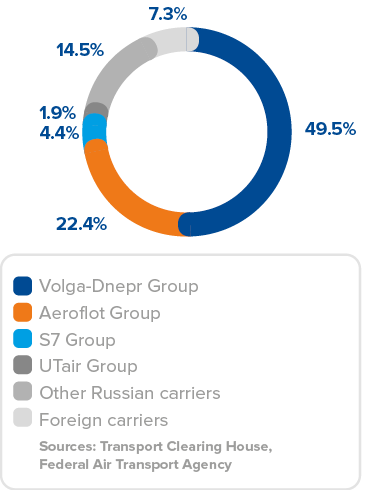
As at the year-end, Volga-Dnepr Group remained the aircargo market leader in Russia (49.5%), and Aeroflot Group ranked second with 22.4%. Top 4 players account for 78.2% of the total cargo traffic.
Russian air cargo market by volume in 2017
Russian air cargo market volume, (including foreign carriers)
THOUSAND TONNES
1 “Net” market is calculated on the base of traffic statistics for the Russian market including foreign carriers but excluding connecting passengers on international flights. The “net” market figures provide for a more accurate representation of the Group’s Russian market share since passengers flying between Europe and Asia (for instance) and making connections in Moscow by definition are not originating or terminating their trips in the Russian cities.