Operating Highlights
Aeroflot Group: all flights
| Item | 2013 | 2014 | 2015 | 2016 | 2017 |
| Passenger traffic, million PAX | 31.4 | 34.7 | 39.4 | 43.4 | 50.1 |
| change, % | 14.3 | 10.7 | 13.4 | 10.3 | 15.4 |
| Passenger turnover, billion RPK | 85.3 | 90.1 | 97.6 | 112.1 | 130.2 |
| change, % | 14.3 | 5.6 | 8.4 | 14.8 | 16.2 |
| Available seat-kilometres, billion ASK | 109.1 | 115.8 | 124.7 | 137.7 | 157.2 |
| change, % | 14.1 | 6.2 | 7.7 | 10.4 | 14.2 |
| Passenger load factor, % | 78.2 | 77.8 | 78.3 | 81.4 | 82.8 |
| change, p.p. | 0.1 | (0.4) | 0.5 | 3.1 | 1.4 |
| Cargo and mail, thousand tonnes | 204.6 | 166.3 | 156.3 | 205.8 | 273.4 |
| change, % | (8.6) | (18.7) | (6.0) | 31.6 | 32.8 |
| Revenue tonne-kilometres, billion TKM | 8.7 | 8.8 | 9.5 | 11.0 | 13.0 |
| change, % | 9.3 | 1.9 | 7.0 | 16.5 | 17.7 |
| Flights, thousand | 264.9 | 286.7 | 323.8 | 331.9 | 368.5 |
| change, % | 9.5 | 8.2 | 13.0 | 2.5 | 11.0 |
| Stage length, km | 2,717 | 2,593 | 2,479 | 2,581 | 2,598 |
| change, % | 0.0 | (4.5) | (4.4) | 4.1 | 0.7 |
Aeroflot Group: domestic flights
| Item | 2013 | 2014 | 2015 | 2016 | 2017 |
| Passenger traffic, million PAX | 14.0 | 17.6 | 23.4 | 25.1 | 27.6 |
| change, % | 21.6 | 26.0 | 32.5 | 7.6 | 9.7 |
| Passenger turnover, billion RPK | 29.2 | 35.0 | 44.7 | 48.7 | 53.2 |
| change, % | 19.8 | 19.9 | 27.8 | 8.9 | 9.3 |
| Available seat-kilometres, billion ASK | 37.6 | 43.6 | 56.3 | 58.3 | 63.8 |
| change, % | 18.2 | 16.2 | 29.0 | 3.7 | 9.4 |
| Passenger load factor, % | 77.7 | 80.2 | 79.4 | 83.5 | 83.4 |
| change, p.p. | 1.0 | 2.5 | (0.8) | 4.1 | (0.1) |
| Cargo and mail, thousand tonnes | 82.8 | 82.0 | 79.1 | 107.8 | 120.0 |
| change, % | 17.1 | (0.9) | (3.4) | 36.2 | 11.3 |
| Revenue tonne-kilometres, billion TKM | 3.0 | 3.5 | 4.3 | 4.8 | 5.3 |
| change, % | 19.2 | 17.4 | 24.5 | 11.9 | 8.9 |
| Flights, thousand | 127.8 | 151.0 | 195.0 | 196.0 | 215 |
| change, % | 13.4 | 18.2 | 29.2 | 0.5 | 9.7 |
| Stage length, km | 2,083 | 1,982 | 1,912 | 1,935 | 1,929 |
| change, % | (1.5) | (4.8) | (3.5) | 1.2 | (0.4) |
Aeroflot Group: international flights
| Item | 2013 | 2014 | 2015 | 2016 | 2017 |
| Passenger traffic, million PAX | 17.4 | 17.1 | 16.0 | 18.3 | 22.5 |
| change, % | 8.9 | (1.7) | (6.2) | 14.1 | 23.3 |
| Passenger turnover, billion RPK | 56.1 | 55.1 | 52.9 | 63.4 | 77.0 |
| change, % | 11.6 | (1.8) | (3.9) | 19.8 | 21.4 |
| Available seat-kilometres, billion ASK | 71.5 | 72.2 | 68.5 | 79.4 | 93.4 |
| change, % | 12.0 | 1.0 | (5.2) | 15.8 | 17.8 |
| Passenger load factor, % | 78.4 | 76.3 | 77.3 | 80.0 | 82.5 |
| change, p.p. | (0.3) | (2.1) | 1.0 | 2.7 | 2.5 |
| Cargo and mail, thousand tonnes | 121.8 | 84.3 | 77.2 | 98.0 | 153.3 |
| change, % | (20.5) | (30.8) | (8.5) | 27.0 | 56.5 |
| Revenue tonne-kilometres, billion TKM | 5.7 | 5.3 | 5.2 | 6.2 | 7.7 |
| change, % | 4.9 | (6.1) | (4.3) | 20.3 | 24.5 |
| Flights, thousand | 137.1 | 135.7 | 128.8 | 135.9 | 153.4 |
| change, % | 6.2 | (1.0) | (5.1) | 5.5 | 12.9 |
| Stage length, km | 3,226 | 3,223 | 3,304 | 3,468 | 3,416 |
| change, % | 2.4 | (0.1) | 2.5 | 5.0 | (1.5) |
Aeroflot Group
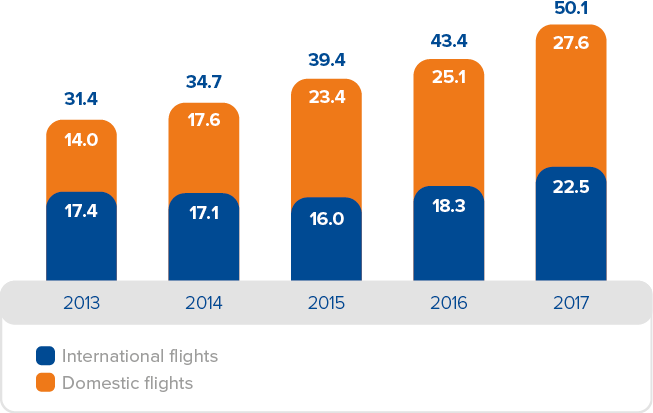
During the year, Aeroflot Group carried a total of 50.1 million passengers, up 15.4% year-on-year, making 368,500 flights or more than 1,000 flights per day on average. The Group’s turnover grew 16.2% to 130.2 billion RPK. On the back of the capacity growth by 14.2% to 157.2 billion ASK the passenger load factor increased by 1.4 p.p. to 82.8%.
Aeroflot Group’s passenger traffic
MILLION PAX
Aeroflot Group’s passenger turnover and passenger load factor
BILLION RPK AND %

Domestic flights
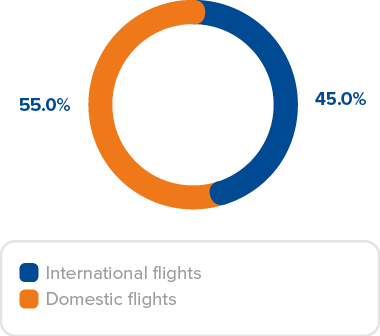
In the reporting year, Aeroflot Group’s total domestic passenger traffic (scheduled and charter) increased by 9.7% year-on-year to 27.6 million passengers (with 26.7 million passengers on scheduled flights). Domestic flights accounted for 55.0% of the total carried passengers.
The passenger turnover grew 9.3% to 53.2 billion RPK while the capacity was up 9.4% to 63.8 billion ASK. The passenger load factor decreased by 0.1 p.p. to 83.4%.
Such performance improvements were associated with the persistently strong demand for domestic services (including domestic tourism), which allowed the Group to increase its flight frequency on the most popular routes and launch new routes.
Aeroflot Group’s operational performance by region (scheduled and charter flights)
Region |
Passenger traffic, million PAX |
Passenger turnover, billion RPK |
Available seat-kilometres, billion ASK | Passenger load factor, % |
||||||||
| 2016 | 2017 | change, % | 2016 | 2017 | change, % | 2016 | 2017 | change, % | 2016 | 2017 | change, p.p. | |
| Russia | 24.7 | 26.7 | 7.9 | 47.9 | 51.4 | 7.2 | 57.5 | 61.9 | 7.7 | 83.4 | 83.0 | (0.4) |
| Europe | 9.0 | 10.5 | 17.0 | 20.1 | 23.8 | 18.7 | 26.5 | 30.5 | 15.2 | 75.6 | 77.9 | 2.3 |
| Asia | 3.1 | 3.4 | 11.2 | 19.8 | 21.9 | 10.7 | 24.8 | 26.6 | 7.2 | 79.9 | 82.5 | 2.6 |
| CIS | 2.4 | 2.8 | 18.2 | 5.4 | 6.2 | 14.8 | 6.6 | 7.4 | 12.2 | 82.2 | 84.1 | 1.9 |
| Middle East | 1.5 | 1.9 | 26.8 | 4.6 | 5.7 | 23.7 | 6.0 | 7.1 | 19.5 | 77.7 | 80.4 | 2.7 |
| Americas | 0.9 | 1.0 | 11.2 | 7.9 | 8.6 | 9.1 | 9.3 | 10.4 | 12.2 | 84.9 | 82.6 | (2.3) |
| Scheduled flights | 41.7 | 46.4 | 11.5 | 105.7 | 117.7 | 11.3 | 130.6 | 144.0 | 10.2 | 80.9 | 81.7 | 0.8 |
| Charter flights | 1.8 | 3.7 | 108.2 | 6.4 | 12.5 | 96.9 | 7.0 | 13.3 | 89.3 | 91.1 | 94.6 | 3.6 |
| Total flights | 43.4 | 50.1 | 15.4 | 112.1 | 130.2 | 16.2 | 137.7 | 157.2 | 14.2 | 81.4 | 82.8 | 1.4 |
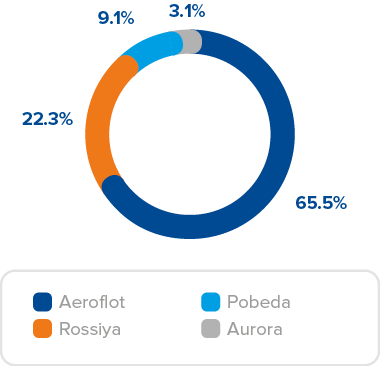
Aeroflot Group’s 2017 passenger traffic breakdown by airline
Aeroflot Group’s 2017 passenger traffic breakdown by destination
International flights
In the reporting year, Aeroflot Group’s international passenger traffic increased by 23.3% year-on-year to 22.5 million passengers. International flights accounted for 45.0% of the total carried passengers.
The passenger turnover grew 21.4% to 77.0 billion RPK while the capacity was up 17.8% to 93.4 billion ASK. The passenger load factor increased by 2.5 p.p. to 82.5%.
The international segment performance was driven by such factors as the improving demand, rouble appreciation, launch of new services and increasing flight frequencies by Aeroflot airlinebased on obtained traffic rights, Rossiya airline’s growing exposure to leisure segment on the back of recovery, and development of Pobeda’s international network. The changing competitive environment, in particular, the return of foreign carrier capacities to the Russian market, also influenced Aeroflot’s operational performance.
The Middle East accounted for the highest passenger traffic growth in 2017, driven by the increased frequency of flights to Tel Aviv in 2016 and the recovery of the flight schedule to Turkey (Istanbul, Antalya) to historic levels, supported by the high demand for the region).
The scheduled passenger traffic on European routes grew by 17.0% to 10.5 million passengers, driven by Aeroflot’s frequency additions (including in 2016) to London, Rome, Milan, Hamburg, and some other European cities, the newly launched services to Lisbon, and Rossiya’s new route from Moscow (Vnukovo airport) to Barcelona.
Aeroflot Group continued to focus on Asian destinations, where the number of passengers carried on scheduled flights grew by 11.2% to 3.4 million, driven, among other factors, by the higher frequency of flights to Hanoi and Delhi.
The number of passengers carried on scheduled flights within the CIS grew 18.2% to 2.8 million due to the launch of a flight to Kostanay and the higher frequency of flights to Yerevan. Furthermore, the higher demand helped the Group increase the number of flights to the region’s key destinations – cities of Kazakhstan, Belarus, Uzbekistan, and Georgia.
The number of passengers carried on scheduled flights to North and Central America increased by 11.2% to 1.0 million, due to the launch of the third daily flight to New York and the stable demand of transfer passengers driven by better flight connectivity.
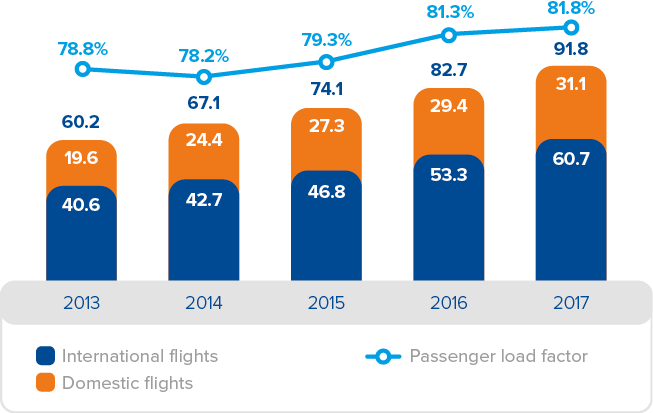
Aeroflot airline
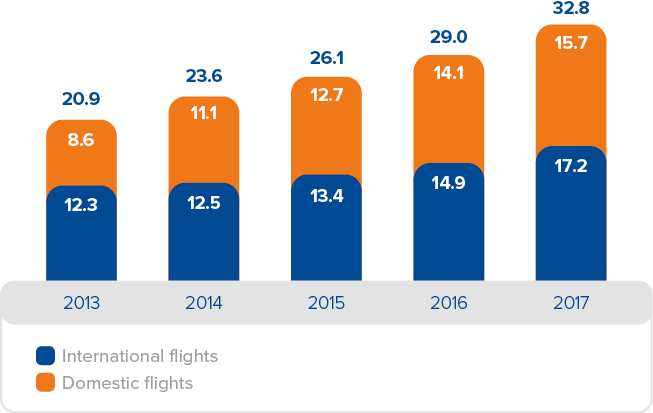
In 2017, Aeroflot airline carried a total of 32.8 million passengers, up 13.3% year-on-year, making 243,317 flights.
The airline’s passenger turnover grew 11.0% to 91.8 billion RPK, backed by the 10.3% capacity growth to 112.2 billion ASK. The passenger load factor increased by 0.5 p.p. to 81.8%.
Aeroflot airline’s passenger traffic
MILLION PAX
Aeroflot airline’s passenger turnover and passenger load factor
BILLION RPK AND %
Domestic flights
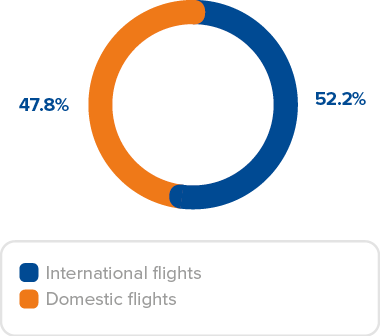
In 2017, the total number of passengers (scheduled and charter) carried by Aeroflot airline on domestic routes increased by 11.3% year-on-year to 15.7 million. The passenger turnover grew 6.1% to 31.1 billion RPK, with the capacity growing by 7.4% to 36.9 billion ASK. The passenger load factor decreased by 1.1 p.p. to 84.3%. Domestic flights accounted for 47.8% of Aeroflot airline’s total passenger traffic.
Aeroflot Group’s operational performance by region (scheduled and charter flights)
| Region | Passenger traffic, million PAX |
Passenger turnover, billion RPK |
Available seat-kilometres, billion ASK |
Passenger load factor, % |
||||||||
| 2016 | 2017 | change, % | 2016 | 2017 | change, % | 2016 | 2017 | change, % | 2016 | 2017 | change, p.p. | |
| Russia | 14.1 | 15.7 | 11.2 | 29.4 | 31.1 | 6.1 | 34.4 | 36.9 | 7.4 | 85.4 | 84.4 | (1.1) |
| Europe | 7.7 | 8.9 | 15.3 | 17.3 | 20.1 | 16.7 | 22.9 | 26.2 | 14.5 | 75.4 | 76.9 | 1.5 |
| Asia | 2.8 | 3.1 | 11.3 | 19.3 | 21.4 | 10.6 | 24.1 | 25.8 | 7.1 | 80.2 | 82.8 | 2.6 |
| CIS | 2.1 | 2.5 | 16.5 | 4.7 | 5.4 | 15.0 | 5.7 | 6.4 | 13.1 | 82.5 | 83.9 | 1.3 |
| Middle East | 1.4 | 1.7 | 24.9 | 4.1 | 5.1 | 23.7 | 5.4 | 6.4 | 19.2 | 77.4 | 80.3 | 2.9 |
| Americas | 0.9 | 1.0 | 10.8 | 7.9 | 8.6 | 9.1 | 9.3 | 10.4 | 12.2 | 84.9 | 82.6 | (2.3) |
| Scheduled flights | 29.0 | 32.8 | 13.3 | 82.7 | 91.8 | 11.0 | 101.7 | 112.2 | 10.3 | 81.3 | 81.8 | 0.5 |
| Charter flights | 0.01 | 0.01 | 38.3 | 0.03 | 0.03 | (0.7) | 0.08 | 0.09 | 3.3 | 31.5 | 30.3 | (1.2) |
| Total flights | 29.0 | 32.8 | 13.3 | 82.7 | 91.8 | 11.0 | 101.8 | 112.2 | 10.3 | 81.3 | 81.8 | 0.5 |
International flights
In 2017, the total number of passengers carried by Aeroflot airline on international routes increased by 15.3% year-on-year to 17.2 million. The passenger turnover grew 13.7% to 60.7 billion RPK, with the capacity growing by 11.8% to 75.3 billion ASK. The passenger load factor increased by 1.4 p.p. to 80.6%. International flights accounted for 52.2% of Aeroflot airline’s total passenger traffic.
Aeroflot airline’s operating results by region are explained by the above-mentioned factors, which influenced the Group’s overall performance.
Charter flights
Aeroflot airline made 285 charter flights in 2017, including special flights to transport sportsmen and officials during the FIFA Confederations Cup, the national football and hockey teams, Russia’s Olympic team, and Manchester United FC.
Aeroflot Group’s 2017 passenger traffic breakdown by destination
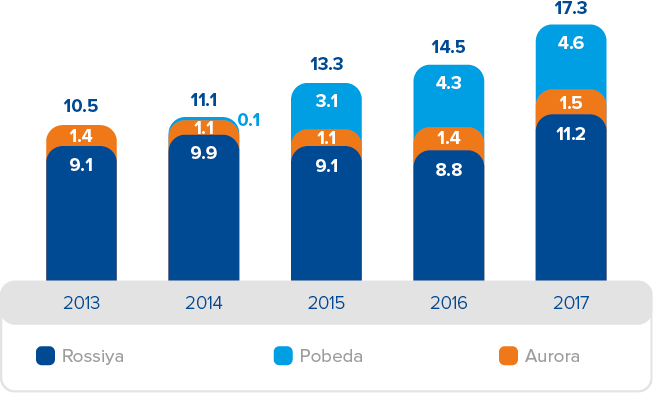
Subsidiary airlines: Rossiya, Pobeda and Aurora
In the reporting year, the total passenger traffic of Rossiya, Pobeda, and Aurora subsidiary airlines was 17.3 million passengers, accounting for 34.5% of the total number of passengers carried by Aeroflot Group in 2017.
Rossiya airline recorded the highest growth rate in 2017, with 11.2 million passengers carried and the passenger traffic on pro-forma basis up 26.7%1, driven by the higher demand in the leisure market and the capacity supply for charter flights offered together with Biblio Globus tour operator. Saint Petersburg delivered high growth rates with Rossiya airline carrying 5.5 million passengers via Pulkovo airport, up 16.8% year-on-year2. More than a third of passengers were carried on charter flights.
During nine months of 2017, Pobeda airline operated a 12-aircraft fleet and received four more aircraft in forth quarter. Thus, the passenger traffic growth to 4.6 million was primarily driven by the growing passenger load factor to record 94.2%, and by capacity additions in Q4 following the fleet expansion.
In the reporting period, Aurora airline continued to expand into the Far East and increase the mobility of the population. In 2017, the airline carried 1.5 million passengers, up 12.5% year-on-year. Local flights to remote destinations were also growing rapidly. The passenger traffic on these routes totalled 63,300 passengers within the Sakhalin Region, 36,200 passengers within the Primorsky Region, and 58,200 passengers on inter-regional flights.
Subsidiaries’ passenger traffic3
MILLION PAX
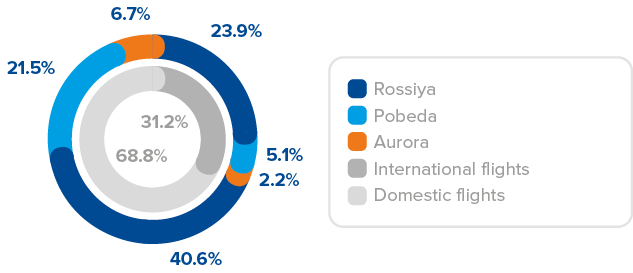
Subsidiaries’ 2017 passenger traffic breakdown3
Cargo and mail operations
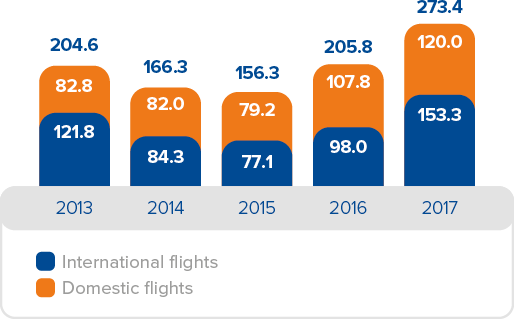
Aeroflot Group does not have a dedicated cargo fleet and exploits a belly cargo model for cargo and mail transportation. In 2017, Aeroflot Group carried 273,400 tonnes of cargo and mail, up 32.8% year-on-year.
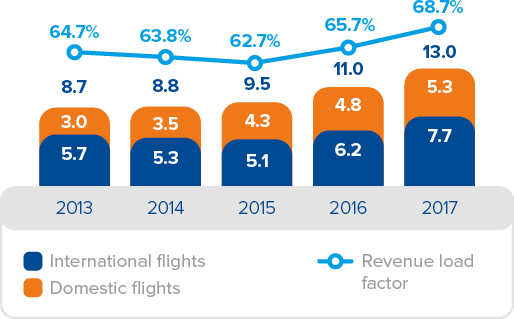
In the reporting period, the cargo/mail tonne-kilometres (TKM) increased by 17.7% to 13.0 billion TKM, while the revenue load factor went up by 3.0 p.p. to 68.7%.
The growth in cargo and mail operations is associated with the upbeat demand and the expansion of the wide-body aircraft fleet, including high cargo capacity Boeing 747s and Boeing 777s added to the Group’s fleet in 2016–2017.
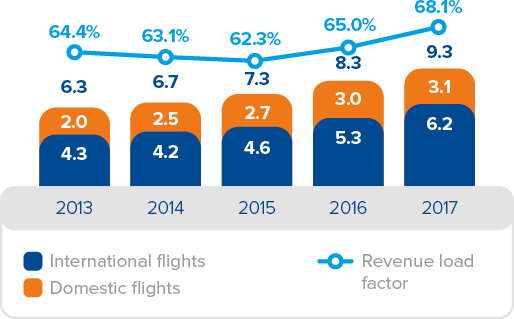
In 2017, Aeroflot airline carried 226,600 tonnes of cargo and mail, up 29.1% year-on-year. The cargo/mail tonne-kilometres increased by 12.9% to 9.3 billion, while the revenue load factor grew by 3.1 p.p. year-on-year to 68.1%.
Aeroflot Group’s cargo and mail operations
THOUSAND TONNES
Aeroflot Group’s revenue tonne-kilometres and revenue load factor
BILLION TKM AND %
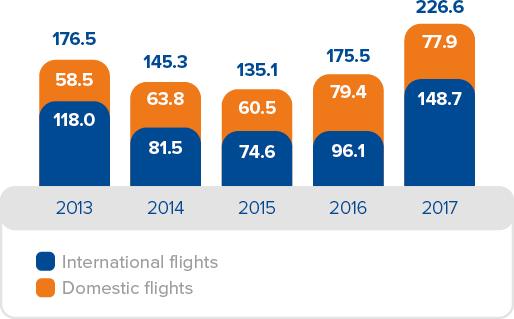
Aeroflot airline’s cargo and mail operations
THOUSAND TONNES
Aeroflot airline’s revenue tonne-kilometres and revenue load factor
BILLION TKM AND %
1 The growth rate calculation includes the passenger traffic
of Donavia and Orenair airlines in Q1 2016 prior to their
consolidation into united Rossiya airline.
2 Including the Saint Petersburg – Moscow (Vnukovo) route.
3 Data on Rossiya airline for 2013–2016 includes flights of
Orenair and Donavia prior to their consolidation into Rossiya
airline.